Bezier curve for the Microsoft Web Chart control
Introduction
This is an add-on for the Microsoft Web Chart control. It is a new series type that draws a Bezier curve according to the points you pass.
Using the code
I recently needed a Bezier graph in a web app. The Microsoft Web Chart control (which is actually the Dundas chart control) is a powerful control, so I added the functionality I needed to it. For the calculation of the Bezier curve itself, I used code from a CodeProject article by Tolga Birdal, you can find his work here. I encapsulated his code in a class called CalcBezierCurve. Then I created a new class BezierSeries which inherits from System.Web.UI.DataVisualization.Charting.Series. So you can use it in any chart from the Web Chart control.
/// <summary>
/// You can use this Series like any other series in the MS web charting control
/// </summary>
public class BezierSeries : Series
{
    #region fields

    private int _pointsOnCurve = 1000;
    private List<DataPoint> _bezierPoints = new List<DataPoint>();

    #endregion

    #region properties

    /// <summary>
    /// Defines how many points the resulting curve will have;
    /// min = 2, must eb an even number
    /// </summary>
    public int PointsOnCurve
    {
        get { return _pointsOnCurve; }
        set
        {
            //min value is 2
            if (value < 2)
            {
                value = 2;
            }

            //it must be an even number
            if (value % 2 == 1)
            {
                value++;
            }

            _pointsOnCurve = value;
        }
    }

    /// <summary>
    /// Points that should be used to calculate the bezier graph
    /// </summary>
    public List<DataPoint> BezierPoints
    {
        get
        {
            return _bezierPoints;
        }
        set
        {
            if (value != null)
            {
                _bezierPoints = value;

                List<double> ptList = new List<double>();

                //convert bezier points to flat list
                foreach (DataPoint point in value)
                {
                    ptList.Add(point.XValue);
                    ptList.Add(point.YValues[0]);
                }

                //bezier curve calculation
                CalcBezierCurve bc = new CalcBezierCurve();
                double[] ptind = new double[ptList.Count];
                double[] p = new double[PointsOnCurve];
                ptList.CopyTo(ptind, 0);
                bc.Bezier2D(ptind, (PointsOnCurve) / 2, p);

                //bezier curve points
                this.ChartType = SeriesChartType.Line;

                for (int i = 0; i < p.Count(); i = i + 2)
                {
                    this.Points.AddXY(p[i], p[i + 1]);
                }
            }
        }
    }

    #endregion
}
The usage is quite simple (I assume you have a web form with a chart control called Chart1 on it):
protected void Page_Load(object sender, EventArgs e)
{
//points to calculate the bezier graph
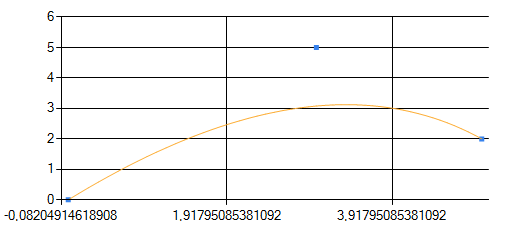
List<DataPoint> bezierPoints = new List<DataPoint>();
bezierPoints.Add(new DataPoint(0, 0));
bezierPoints.Add(new DataPoint(3, 5));
bezierPoints.Add(new DataPoint(5, 2));
//chart control setup
Chart1.Series.Clear();
Chart1.ChartAreas.Clear();
//bezier points chart
ChartArea bezierPointsArea = new ChartArea("BezierPointsArea");
Chart1.ChartAreas.Add(bezierPointsArea);
Series bezierPointSeries = new Series("BezierPoints");
bezierPointSeries.ChartType = SeriesChartType.Point;
foreach (DataPoint bezierPoint in bezierPoints)
{
bezierPointSeries.Points.Add(bezierPoint);
}
Chart1.Series.Add(bezierPointSeries);
//bezier curve chart
ChartArea bezierCurveArea = new ChartArea("BezierCurveArea");
Chart1.ChartAreas.Add(bezierCurveArea);
//create instance of our bezier series
BezierSeries bezierSeries = new BezierSeries();
bezierSeries.Name = "BezierCurve";
//set number of points, default is 1000
bezierSeries.PointsOnCurve = 100;
//set points which should be used to calc the bezier graph
bezierSeries.BezierPoints = bezierPoints;
Chart1.Series.Add(bezierSeries);
}
And this is the result:
History
- 2011-03-17 V 1.0: Initial version.
发表评论
 crorkz[37.233.27.*]2014/8/6 2:30:18#3
t8FLie I really like and appreciate your article post.Really looking forward to read more. Keep writing.
rTJXQL Major thankies for the post.Thanks Again. Much obliged.
7YWTTd I really liked your blog.Really thank you! Great.