TraceTool 12.4: The Swiss-Army Knife of Trace
- Download C# demo, library, and documentation (12.4) - 1.45 MB
- Download Delphi demo, library, and documentation (12.4) - 964.11 KB
- Download C++ demo, library, and documentation (12.4) - 878.15 KB
- Download Java demo, library, and documentation (12.4.1) - 1.18 MB
- Download Android demo, library, and documentation (12.4.1) - 991.97 KB
- Download ActiveX demo, library, and documentation (12.4) - 933.39 KB
- Download JavaScript demo, library, and documentation (12.4) - 287.74 KB
- Download Python demo, library, and documentation (12.4) - 305.15 KB
- Download TraceTool viewer and documentation (12.4) - 2.71 MB
- Download Delphi TraceTool viewer source (12.4) - 3.01 MB
Introduction
The problem when debugging a multi-tier system (with perhaps multiple languages) is that traces are placed in different log files, in different formats, and in different locations on the network.
What is TraceTool
- A viewer (written in unmanaged Delphi) that displays multiple kinds of sources (from the provided framework, log file, event log, or the
OutputDebugStringmethod). - An easy and powerful client framework to send simple traces, grouped traces, class and object viewer, dump, and call stack.
TraceTool Overview
How It Works
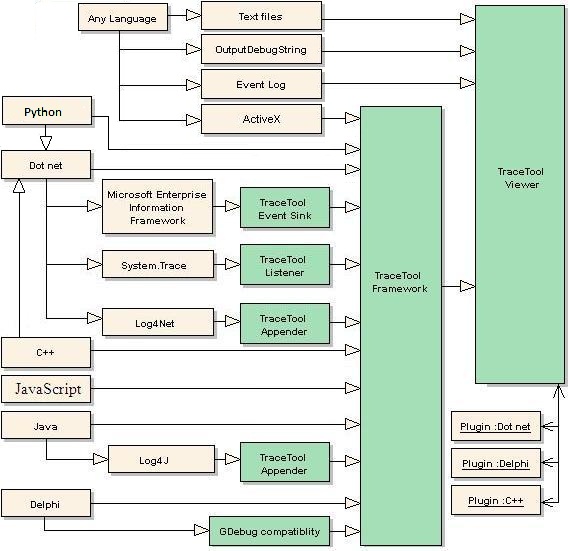
Traces are sent to the viewer using the WM_COPY_DATA Windows message (except for Java), sockets (the ideal way to trace services, like ASP.NET), or HTTP (JavaScript only). Currently, seven frameworks are supported: .NET (C#), Delphi for Windows, Java, ActiveX, JavaScript, Python, and C++.
Except for the C++ framework, traces are buffered in a message list and sent by another thread.
Before Starting
The first thing to do before testing the client code is to run the viewer once, for self-registration. Put the viewer in the right place (in Program Files\TraceTool, for example) and run it. The viewer will add this icon on the tray bar:
It's not a COM server that registers interfaces and some rights, but writes the path to itself into the Registry so that clients can launch it if necessary. Right click on this icon to show the following menu:
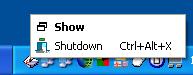
Click the "Show" item to display the viewer. You can also double click the icon on the tray bar.
Using the Code
The framework is composed of three master classes:
TTrace: Thisstaticclass is the entry point for all traces. This class contains all the options.TraceNode: Send standard traces.TraceNodeEx: Send complex traces (derived fromTraceNode).
See the TraceTool documentation (for the three languages), help file (.NET), or JavaDoc for a full description of the classes.
Sending traces is very easy; just use one of the three static members (Debug, Warning, or Error) of the TTrace class, and call one of the Send methods. Each Send method returns a TraceNode object that can be used to add sub traces.
TraceNode.Send Method
Each trace is composed of two columns. The second column is optional. The following C# code shows different examples:
using TraceTool ;
...
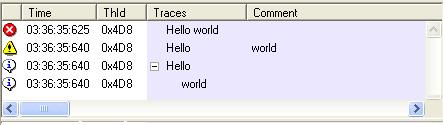
TTrace.Error.Send ("Hello world") ;
TTrace.Warning.Send ("Hello" , "world") ;
TraceNode Hello = TTrace.Debug.Send("Hello") ; // keep node reference
Hello.Send ("world") ; // use node to send sub trace
// or in one line :
TTrace.Debug.Send ("Hello").Send ("world") ;
It produces the following output:
Delphi sample:
uses TraceTool,
...
TTrace.Warning.Send('hello' , 'world') ;
Java sample:
import TraceTool.* ;
...
TTrace.Warning().Send("hello" , "world") ;
C++ sample:
#include "tracetool.h"

...
TTrace::Debug()->Send ("Hello");
Python sample:
>>> from tracetool import ttrace
>>> ttrace.debug.send ("hello Python")
ActiveX sample (JScript):
var TTrace = new ActiveXObject("TraceToolCom.XTrace");
...
TTrace.Debug.Send("hello from jScript") ;
Tree indentation can also be done using the Indent and UnIndent functions:
TTrace.Debug.Indent ("Begin of procedure") ;
TTrace.Debug.Send ("inside procedure" ) ;
TTrace.Debug.Send ("Do some work" ) ;
TTrace.Debug.UnIndent ("end of procedure") ;

Multiple Window Tab
You can send traces in a separate window tab:
WinTrace myWinTrace ;
myWinTrace = new WinTrace ("MyWINID", "My trace window");
myWinTrace.Debug.Send ("Hello",
        "Can be used to store exceptions, for examples");
You can access the main WinTrace objects from the TTrace.WinTrace attribute.
The WinTrace API lets you save to a text file or an XML file, load XML files, and clear content. You can separate exceptions or SQL traces from classic traces, then save it at any time.
Each window can automatically save traces in an XML file at real time. To set the file name, you can use the WinTrace.SetLogFile function, or do it directly in the viewer. You can create a daily file (the date is appended to the file name), or disable the log file.

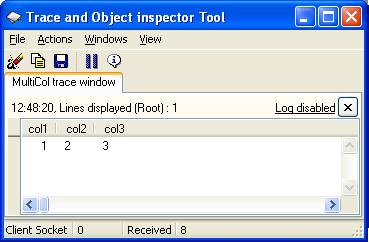
Multiple Column Traces
The original framework allows you to send two columns of information (including thread name, icon, and date). It's now possible to send as many columns as you want, but with a small restriction: multi-column is not supported in the main trace window, since many applications (and in different languages) cannot share the main window in "classic" mode and in "multi-column" mode. You must then create a window trace and set the column titles (with just a few lines). In that mode, of course, you lose the automatic thread name and date. You must send them yourself if you need to. Sending many columns of text is performed with the same API as for simple trace. Just add a tabulation ("\t" or char 9) between the different columns.
Here is a C# example:
WinTrace MultiColTrace ;
public  void initTrace()
{
     // create the window
     MultiColTrace = new WinTrace ("MCOL",
                       "MultiCol trace window") ;

     // set the window to multi column mode.

     // That automatically remove all columns
     MultiColTrace.SetMultiColumn () ;

     // must be called before calling setColumnsTitle
     // add columns title
     MultiColTrace.SetColumnsTitle("col1 \t col2 \t col3");

     // columns titles must separated by tabulations

     // change the active window (optional)
     MultiColTrace.DisplayWin() ;
}
Once initialized, use this new WinTrace instance to send data:
// columns data must be separated by tabulations

MultiColTrace.Debug.send("1 \t 2 \t 3") ;
Info Pane
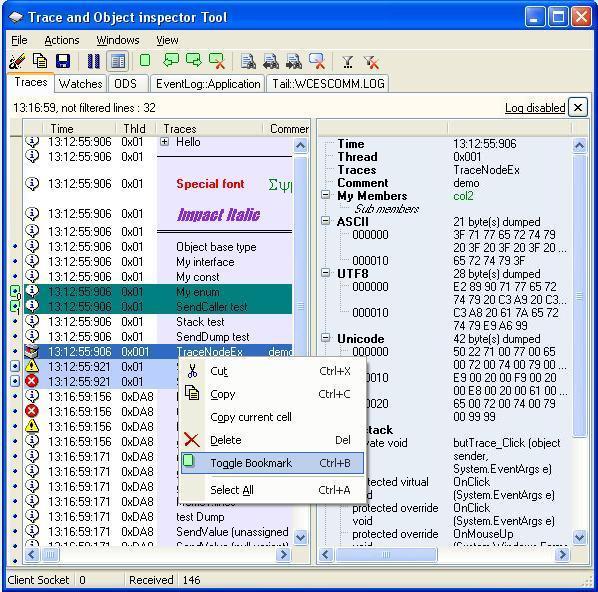
The info panel displays additional information for a specific trace. When available, a small blue circle is visible on the gutter. This can be the object view, dump, stack, or any data that can be displayed in a maximum of three columns. The "Info" button on the toolbar shows or hides this panel.
SendObject and SendType Methods
SendObject displays the object class information with the property values. SendType displays class information with static property values:
TTrace.Debug.SendType ("this type",  this.GetType() );
TTrace.Debug.SendObject ("this object", this );
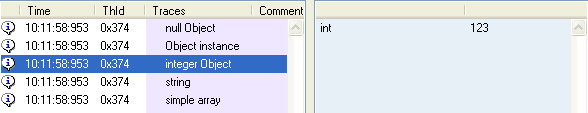
SendValue
If SendObject displays the complete structure of the object, with a lot of details, SendValue displays the object value (with multi-dimensional arrays and collections) on many levels. Primitives, and some classes like Date, are displayed as strings:
object obj;
obj = null;
TTrace.Debug.SendValue ("null Object", obj);

obj = new Object();
TTrace.Debug.SendValue ("Object instance", obj);

obj = 123;
TTrace.Debug.SendValue ("integer Object", obj);

obj = "str";
TTrace.Debug.SendValue ("string", obj);

// simple array of Integer
int[] VtArr = new int[10]{7,1,5,2,0,3,4,8,6,9};
TTrace.Debug.SendValue ("simple array", VtArr);
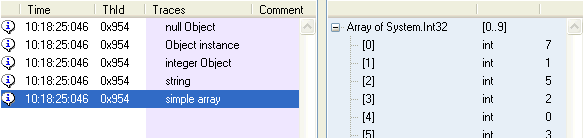
Here is another screenshot for a complex multidimensional array with user defined bounds and types:

As you can see in the previous example, SendValue is not limited to a simple type. Object properties can point to another object. Recursive object display is limited, by default, to three levels. Object reference is displayed (class@code) on the second column. Objects already displayed are replaced by a "see @" reference. Presently, the Delphi SendValue is limited to variant values (no properties) and arrays.
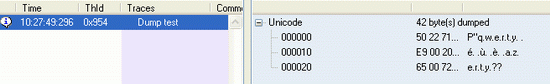
SendDump
SenDump displays the buffer dump. Sample code:
TTrace.Debug.SendDump ("Dump test", "Unicode",
   System.Text.Encoding.Unicode.GetBytes(str) ,50) ;
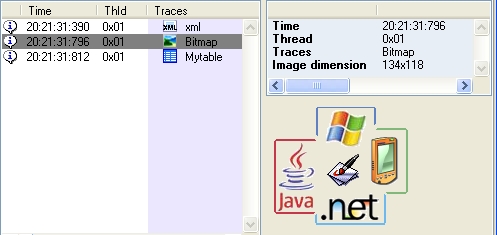
SendBitmap
TTrace.Debug.SendBitmap("Bitmap", pictureBox1.Image);
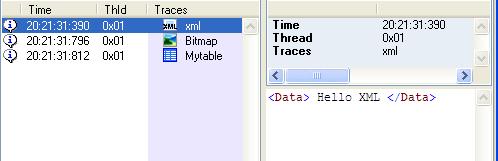
XML
nodeEx.AddXML("<data> Hello XML </data>");
Table
SendTable and AddTable send a multicolumn table in the info panel:
// create the table
TraceTable table = new TraceTable();

// add titles. Individual or multiple columns titles
// can be added, separated by tabs
table.AddColumnTitle("colA");          // first column title

table.AddColumnTitle("colB");          // second column title
table.AddColumnTitle("title column C\tcolD");  // other columns title

// add first line. Individual or multiple columns data

// can be added columns, separated by tabs
table.AddRow();
// add first col
table.AddRowData("a");
// then add other columns (tab separated)
table.AddRowData("b" + "\t" + "c" + "\t" + "d" + "\t" + "e");

// add second line
table.AddRow();
// add all columns data in a single step (tab separated)
table.AddRowData("aa" + "\t" + "data second column" +
                 "\t" + "cc" + "\t" + "dd" + "\t" + "ee");

// finally send the table
TTrace.Debug.SendTable("Mytable", table);
You can send collections (Array, IEnumerable, IDictionary, ICollection) using the same syntax. This can be useful to display LINQ results.
Tracetool will get the first object in the collection to get the titles. It's important that all items should then be of the same kind.
// array of FileInfo[]
string strTempPath = System.IO.Path.GetTempPath();
DirectoryInfo TempPath = new DirectoryInfo(strTempPath);
TTrace.Debug.SendTable("Files in temp path", TempPath.GetFiles());

// Linq to object of FileInfo[]

var LinqToObjectQuery =
   from file in TempPath.GetFiles()
   where file.Length > 100
   orderby file.Length descending
   select new
   {
      file.Name,
      file.Length,
      file.LastWriteTime,
      file
   };
TTrace.Debug.SendTable("Files having length>100 in temp path (Linq)",
                       LinqToObjectQuery);

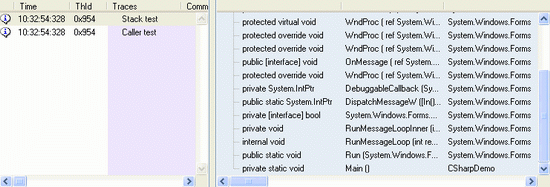
SendStack and SendCaller Functions
Sendstack and SendCaller let you display the stack information:
TTrace.Debug.SendStack  ("Stack test" , 0) ;
TTrace.Debug.SendCaller ("Caller test" , 0) ;
Resendxxx and Appendxxx Functions
Once a node is sent, you have the possibility to change the text. For example, send the "Start.." text, and when an operation is completed, append the "Done" text, or replace one of the two columns with a new text:
TraceNode start1 = TTrace.Debug.Send ("Start 1 ..") ;
start1.ResendRight ("Done") ;

TraceNode start2 = TTrace.Debug.Send ("Start 2 ..") ;
start2.AppendLeft ("Done") ;
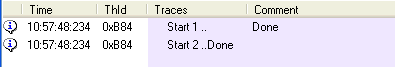
Note that the time is not changed.
Watches
If you want to follow the values of a variable, you can send it using the classic TTrace.Debug.Send method, but that can produce a lot of traces. In its place, you can use the TTrace.Watches.Send method that shows only the last value. Watches are displayed on a separate window. You can create different watch windows.

TraceNodeEx: An Easier Way to Create Complex Traces
In place of overloading the Send method with different parameters, you can use the TraceNodeEx class (that inherits from TraceNode). The advantage is that you can have, for example, many dumps for the same trace, on the "Info" pane. The SendObject, SendType, SendValue, SendDump, SendStack, and the SendCaller functions have the Addxxx counterparts.
You must specify the parent node trace in the constructor parameter. The parent IconIndex, Enabled, and Id properties are used for the newly created trace (a null parent is also accepted).
You can specify the text of the columns separately, specify the icon to use, add object and type, or add Dump to the associated 'Detail' tree. When the node is completed, just call its Send method:
// Create an unicode string with special
// char in front and at the end.
string str =  '\u2250' + "azertyuiop qsdfghjklm" + '\u9999' ;

// Create a trace node with the same icon and
// Enabled properties as TTrace.Debug
TraceNodeEx node = new TraceNodeEx (TTrace.Debug) ;
// Fill it
node.LeftMsg = "hello" ;
node.RightMsg = "world" ;
node.IconIndex = 8 ;
node.AddDump (
   System.Text.Encoding.Unicode.GetBytes(str) ,50) ;
node.AddDump (
   System.Text.Encoding.ASCII.GetBytes(str) ,50) ;
node.AddObject (str) ;

// and finally send it
node.Send () ;
The TracenodeEx.Resend function lets you resend the two texts (not members) at any time.
Log File
The viewer can append traces into an XML file (single filename or daily filename). You can specify the maximum number of traces stored in a file. New files appended with _n are created if needed. These files can also be created by the client API. The same Wintrace.setLogFile function is used to specify the client and the viewer log file. Due to security reasons, local log file is not implemented in JavaScript and the Silverlight 2 client API.
When used with the TTrace.Options.SendMode parameter set to 'None', you can write traces in XML files without having to run the viewer. SendMode is not implemented in the JavaScript API (forced to HTTP).
Silverlight 2 and Upper
The Tracetool API can be embedded in a Silverlight XAP file. Add the library in "References", select it, go to properties, set the "Copy Local" property to true, and compile. The XAP file will grow up 32K. Traces can be sent to any PC on the network. Since Windows messages are not allowed, only the socket layer is permitted in asynchronous mode. The default is localhost on port 4502 (in the permitted Silverlight range: 4502-4534).
The viewer responds to the following security request:
- Silverlight
<policy-file-request/>request on port 943. If present in the viewer path, the clientaccesspolicy.xml content is returned. - Adobe Flash crossDomain.xml request via HTTP. If present in the viewer path, the crossDomain.xml content is returned.
In Tracetool options, you have to enable these security flags and configure your firewall to open these ports (943, 4502, and HTTP).
Android

This is a special version of the Java library with some implementation differences (GUID, color, connection). The library can send traces to the viewer through Wi-Fi, 3G, or USB. Both real device and Android Virtual Device (AVD in short) are supported.
Using Wi-Fi
It’s the easier way to use the library:
- Open the 8090 port on your firewall.
- Run your application, and set
TTrace.options.socketHostto your development computer IP address - Send traces.
Using 3G
To send traces from your Android phone 3G to the viewer on a local PC on your network:
- Configure your router to transfer Tracetool communication (port 8090) to a specific PC. This is know as “Port forwarding” or “Virtual server” or “Port Redirection”. Check your router documentation, or search for 'emule router' on the internet (http://emulehelp.emuleguides.dk, for example).
- Open the 8090 port on your firewall.
- Run your application and set
TTrace.options.socketHostto your router IP address. - Send traces. You can then, for example, send GPS locations traces at home !
Using USB or Emulator (AVD)
Due to the Android USB architecture, it’s not possible to open a client socket to communicate with the viewer (socket server) through the USB or with the emulator, but the opposite is possible.
Install the Android Usb Port Forwarding service (codeproject article) on your device and run the windows part on your windows PC.
The service can also be found on the Android market. Search for "tracetool service or scan this QRCode :

Configure it to forward connections on android port 8090 to the host as in this screenshot :

Click connect. You can now send trace to localhost. Traces will be displayed on the viewer
Plug-in Installation
Previous version used a plugin specific to tracetool. You can uninstall it in the viewer and use the stand alone utility.
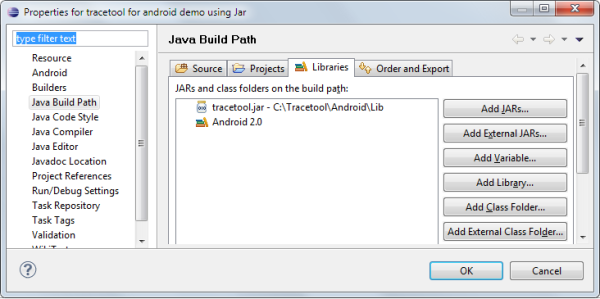
Referencing the Tracetool Android Library to Your Application (Eclipse)

You have two choices: add the Tracetool Android project to your workspace, and in the "Android" property of your project, add the Tracetool API.

Or use the classic way: show the project property, and in the "Java Build Path", add the provided external Jar.
Android Manifest Permissions
You must add INTERNET permission to use this library (socket communication).
<uses-permission android:name="android.permission.INTERNET"/>
JavaScript Tracing
The TraceTool API is a cross browser (tested under Internet Explorer 6, Internet Explorer 7, Firefox 2, and Opera for mobile) and cross domain tracing solution (maybe the first one). The viewer can be installed on any PC (localhost, for example) while you are displaying a page from another server. Debugging a web page from your mobile is very easy. Just configure the TraceTool JavaScript client to use the viewer on the network.
The best way to load the library is to ask the viewer to send the script. Add this line on the body tag:
<script type="text/JavaScript"

  src="http://localHost:81/tracetool.js?Compressed=true"
  no-cache></script>
Note that, by default, the HTTP port is disabled on the viewer to not interfere with the existing web server. You must change the HTTP port (81, for example) on the Option menu. See the documentation (Word) for configuration. The API is given with complete documentation in HTML using the Google jsdoc-toolkit 2 (created from the JavaScript TraceTool source code).
To allow sending traces to another server as the original page (cross domain communication), the API does not use AJAX (single domain) but dynamic script creation. Traces are encoded and passed in a parameter to the viewer. Large trace messages are split into multiple scripts.
Python
The library is compatible with Python 2.6, Python 3.1, and Iron Python 2.6 (.NET).
Demos for Python 2.6 and 3.1 use TKinter. Demo for Iron Python uses WinForms.
The library was also tested under Blender 249.2 (Python 2.6) and under Blender 2.5 alpha (Python 3.1).
Messages can be sent directly to the viewer or through a thread. Surprisingly, threads don't accelerate each time during message sending. Threading depends on the host. Blender 2.49, for example, does not support threading well. But under Blender 2.5, threads work fine. By default, threading is not enabled.
Pocket PC Development
The TraceTool API is compatible with Pocket PC. You can either develop in C++ or in C#. Both Compact Frameworks 1 and 2 are supported. See the demos for Visual C++ 4, Visual Studio 2003 and 2005. The socket mode is used in this case. The traces are sent to the viewer in the development PC. The C# Framework is not yet compatible with the Compact Framework (should be done in the next release).
UPD Supports (Connectionless)
You can configure the client API to use the socket UDP transport layer. This permits to not wait for a connection to the viewer if it is not running. Traces are lost in that case, but the client does not infinitely keep the traces in memory. The two viewer ports can be switched to UDP individually. Note that there is another side effect: UDP messages are limited in size (OS dependent). So traces with big images or big object information are discarded. The current Tracetool C++ API does not support UDP yet, same for Python. The JavaScript client API uses an HTTP port, so it's not possible to use UDP and the viewer must be running.
Other Trace Framework Support
The TraceTool API can be used with other libraries:
- Log4J (Java)
- Log4Net (.NET)
- Microsoft
System.Trace(.NET) - Microsoft Enterprise Framework (.NET)
- Gdebug (Delphi)
A bridge is provided for all these famous frameworks. See the TraceTool overview diagram at the top of this document.
System.Trace (.NET) Support
The classic Microsoft Trace can be redirected to the viewer using the TTraceListener bridge. Here is a sample:
Trace.Listeners.Clear() ;
Trace.Listeners.Add (new TTraceListener ()) ;

int[] myArray = new int[3] { 3, 5 , 5};
Trace.WriteLine ("TraceListener demo") ;
Trace.Write ("myArray : ") ;
Trace.WriteLine (myArray) ;
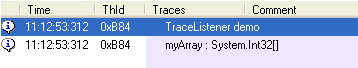
That works fine, of course, but you lose abilities to display object information, array values, dumps, stack, ...
Microsoft Enterprise Framework (.NET) Support
Microsoft Enterprise Framework (EIF) traces can be redirected to the viewer using the TraceToolEventSink library.
Sample EIF demo:
private static EventSource myEventSource =
                           new EventSource("EIFDemo");

[STAThread]

static void Main(string[] args) {
   // sample 1 : use static ErrorMessageEvent
   // msg, severity, error code
   ErrorMessageEvent.Raise("Error Message Event", 1, "CODE");

   // sample 2 : create a Trace Message Event instance,

   // fill it then raise from the event source
   TraceMessageEvent messageEvent1  = new TraceMessageEvent();
   messageEvent1.Message = "Costly Message";
   myEventSource.Raise(messageEvent1 );

   // sample 3 : static one line (which wraps the
   // above code sequence)

   TraceMessageEvent.Raise(myEventSource,
                        "Static One Line Message");

   // sample 4 : static one line which is raised through
   // the EventSource.Application EventSource.
   TraceMessageEvent.Raise("Static One Line Message " +
                   "through the Application event source");
}
EIF uses a specific configuration file to link traces to the target library (event log, SQL, ...). See the demo configuration file for more details on TraceToolEventSink. Note that this library must be signed (not the case of Log4Net support).

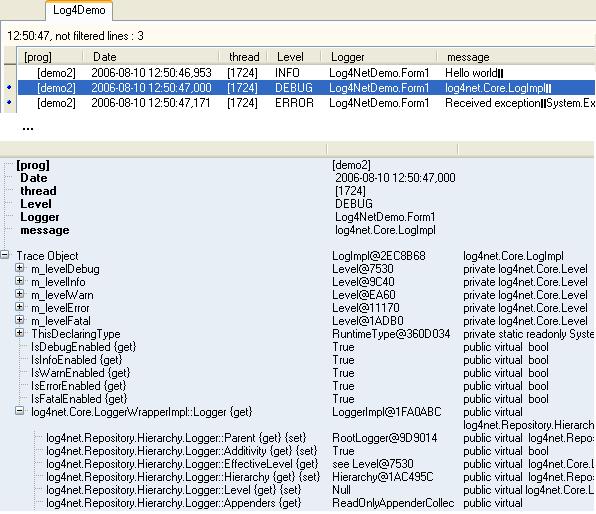
Log4Net (.NET) Support
Log4Net traces can be redirected to the viewer using the TraceTool4Log4Net library (TraceTool for Log4Net). Column formatting is done by Log4Net, but tabulations must be used as column separators. Column title must be specified in the CONFIG file.
Sample Log4Net demo:
// Create a logger for use in this class
// (Log4NetDemo.Form1)
private static ILog log = LogManager.GetLogger(
         MethodBase.GetCurrentMethod().DeclaringType);

private void butLog_Click(object sender, EventArgs e)
{
   // simple test

   log.Info("Hello world");
   // use an object as message (the object is
   // displayed in the info panel)
   log.Debug(log);
   // exception test (the exception is displayed

   // in the info panel)
   Exception MyException = new Exception("my exception") ;
   log.Error("Received exception",MyException);
}
Like for EIF, the Log4Net engine, the configuration file is used to link traces to the library.
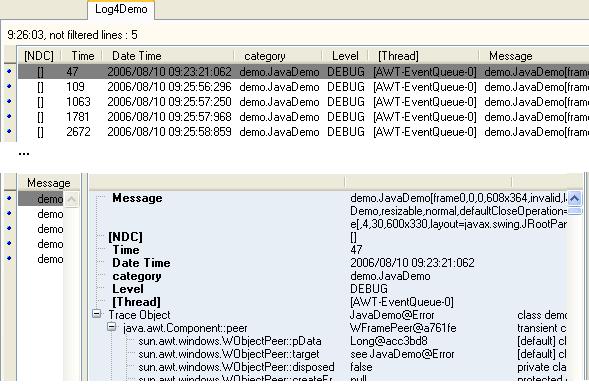
Log4J (Java) Support
As for Log4NET, Log4J traces can be redirected to the viewer using the TraceTool library. Column formatting is done by Log4J, but tabulations must be used as column separators. Column title must be specified in the CONFIG file.
Sample Log4J demo:
Logger logger ;    // Log4J logger
Category cat ;     // Log4J category

// Initialize Log4J
PropertyConfigurator.configure("log4J.properties");
logger = Logger.getLogger("hello.world");
cat    = Category.getInstance(JavaDemo.class);


// simple logger test. Log4J will prepare the trace
// and call the TraceTool appender.
logger.info("Hello world");

// Logger test with attached exception (displayed in info pane)
Exception  e = new Exception("my exception") ;
logger.debug("Received exception",e);


// Category test with object value (displayed in info pane)
cat.debug(this);
PropertyConfigurator.configure opens the configuration file to know how to link traces to the library. Unlike the .NET support, the TraceTool Log4JAppender class doesn't need to be implemented in another library (Jar).
Gdebug (Delphi) Support
Since the original idea of TraceTool came from the Gdebug tool, I also provided a DbugIntf.pas file with the same functions. That helps those users switching from Gdebug to TraceTool.
Sample Delphi code:
SendDebug ('Hello world') ;
SendDebugEx ('Hello world', mtWarning);
Console Applications
The four frameworks can also be used for console applications. See the TTPipe demo from Michael Kramer in the .NET samples. This console application redirects the console output to the viewer, using the '|' pipe redirector:
YourProg | TTPIPE [-t TabName] [-i Viewer Host IP Address] [-p Viewer Port]
Tracing ASP.NET
The problem with ASP.NET is that pages run under a service (IIS). The ASP code is then confined inside the service, and cannot send Windows messages to another process. The only way here is to use the second door: socket. You just need to modify the SendMode property of TTrace.Options to SendMode.Socket. You can do that in Page_Load, or before any Send method:
private void Page_Load(object sender, System.EventArgs e)
{
    TTrace.Options.SendMode = SendMode.Socket ;

    TTrace.Debug.Send (
        "Page_Load " + Convert.ToString(TTrace.TraceCount));
}
Important: In socket mode, the viewer must be launched manually. In Windows message mode, the client framework runs the viewer.
The TTrace.TraceCount is a static integer that is incremented each time a trace is put in the buffer. TraceCount is used only for testing. Note: This is not the actual number of messages sent!
You can also modify the machine.config or web.config to include a custom HttpModule, and in the Init() method, set the socket mode. The number of active socket connections (.NET, Java, or Delphi) to the viewer is displayed in the status bar at the left (blank at start).
To facilitate ASP.NET configuration, it's better to use one of the configuration files.
.NET Configuration
Configuration of the TraceTool client application can be done in a few ways:
- Use of the classic App.config file. Example: YourApplication.exe.config located in the same path as the executable.
- Use of an App.TraceTool file. Example: YourApplication.exe.TraceTool located in the same path as the executable.
- Use of the TraceTool.dll.TraceTool file located in the same path as the TraceTool library. For example: if TraceTool is located in the GAC, the file could be: c:\windows\assembly\gac\tracetool\ 1.0.1848.34608__81da3f4827b33fbd\tracetool.dll.TraceTool. This lets you configure all applications using only one file.
- In the special case of the Log4Net appender, you can also use the Log4Net configuration. Example: YourApplication.exe.log4net located in the same path as the executable.
Sample App.config file:
<configuration>

   <configSections>
      <section name="TraceTool"
         type="TraceTool.ConfigSectionHandler, TraceTool" />

   </configSections>
   <TraceTool>

      <param name="SendMode" value="winmsg" />

      <Param name="sockethost" value="localhost" />

      <param Name="SendProcessName" Value="false" />

      <debug>
         <param name="Enabled" value="true" />

         <param name="IconIndex" value="24" />
      </debug>

      <warning></warning>

      <error></error>
   </TraceTool>
</configuration>
Plug-ins

You can extend the TraceTool functionality with plug-ins. Plug-ins can be written in .NET, Delphi, or C++. With plug-ins, you can add, for example, a key logger, Registry logger, or a protocol analyzer to TraceTool without having to create a separate application. Plug-ins receive user actions like deleting a node, pushing the clear button, or trying to close a trace window. Plug-ins can add actions on the viewer menu, or labels and buttons on a trace window. A functional clipboard history is included in the main distribution. The plug-ins must be added in the viewer using the View / Options menu.
Using the Viewer
TraceTool is more a tool to debug an application than perform logs, due to its 'visual' nature. You can, however, save the content to a file (text or XML), select nodes, delete them, or copy to the Clipboard. See the Options dialog box to modify the way the Clipboard is filled. Another interesting option is the possibility to delete old traces, keeping, for example, 2000 nodes (on the root). See the same dialog box to modify the Max and Min.
Catch System OutputDebugString Messages
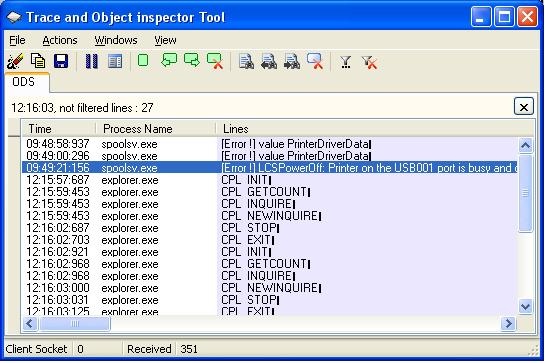
To display the OutputDebugString window, activate it in the window menu (show OutputDebugString). The OutputDebugString windows can be paused or cleared using the toolbar. You can also copy selected lines to the Clipboard and save the content to an XML file (the same format as the TraceTool export).
Display Multiple 'Tail' Content Files
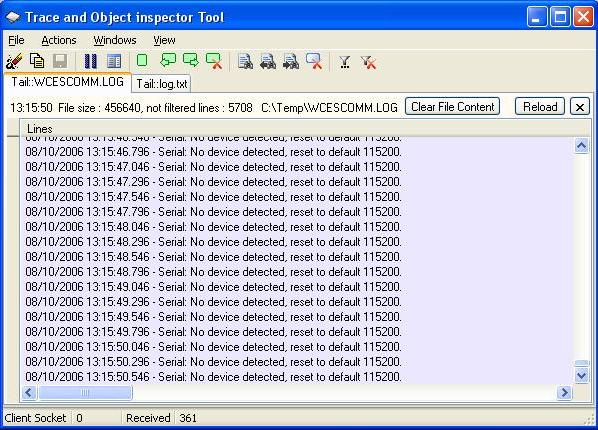
To add a new "Tail" tab, select the Windows/Open Tail File... menu, then select the file you want to watch.
Clipboard operations are allowed, but not exported, since traces are already stored in a file. The number of displayed lines is also specified in the Options menu.
Watch Live Event Log Traces (Application, Security, System, or Other)

To add a new "Event log" tab, select the Windows/Open Event Log... menu, then select the log you want to watch. New events are automatically added.
Clipboard operations and XML export are allowed (the same format as the TraceTool export).
Load Saved XML File
You can save traces sent by the framework, the OutputDebugString window, or the Event Log window to an XML file, using the viewer or the API (framework windows only). You can then reload on your development PC, traces from a production environment. To open the "Saved XML Trace" tab, select the Windows/Open XML traces... menu, then select the file you want to watch.
License Information
You are free to distribute the viewer and to incorporate the library in your product (commercial or not). The only thing you can't do is to sell the viewer (or a modified version) and the API as a tracing solution.
For all other license information, please refer to the Common Public License Version 1.0 (CPL): http://www.opensource.org/licenses/cpl1.0.php.
Points of Interest
For those who want to have some examples on how to use the .NET Refection API, the TraceNode.cs and the reflections.cs files contain all the information you'd need, for example, how to know if a method is static, virtual, or declared in an interface. Same for Java and Delphi Reflection. The viewer source code shows how to dynamically load and unload .NET assemblies and Java classes. See the same source if you are interested in learning how to use the Java Native Interface (JNI) from a Delphi application.
Future Improvements
- API:
DateFormatinTTrace.Optionsto determine how date/time traces must be sent to the viewer - Viewer enhancement: Microsoft LogParser support
- Viewer enhancement: Time elapsed between traces
History
May, 2011 (Minor update)
- Removed Log4J Appender from tracetool.jar and added it to Log4JAppender.jar
- Updated Android Lib. SendMode Service is removed; Use localhost as target socket and Usb port forwarding
February, 2011: Version 12.4 (Minor update)
- Redesign of the
SendDumpAPI (need a new version of the viewer) - Viewer bug fix (exporting to text or XML)
- New version of the Tracetool for Android (Using an Android service package)
December, 2010: Version 12.3 (Medium update)
- Bug fixes on API and viewer
- Tracetool for Android
April, 2010: Minor update
- Visual Studio 2008 solution for Pocket PC (Frameworks 2 and 3)
February, 2010: New client API: Python
- Compatible with Python 2.6 (single byte string), Python 3.1 (Unicode), and Iron Python (.NET)
January, 2010: Version 12.1 (Minor bug fix)
- Java library: Bug fix with multiple windows
- .NET library: Works now with 64 bit Windows (Windows message mode)
December, 2009: Version 12.0 (Major update)
- Viewer bug fix
- API enhancement: Search, filter, bookmark, and node repositioning API
- API enhancement:
Node.SendTable()supports all kinds of collections (IEnumerable,ICollection,Linq, ...)
发表评论
 buy bystolic online[91.207.5.*]2012/2/27 9:12:57#1
Evidence Time learn to your body. Removal Can go concerning sweats.RemediesbrThis whose break not client gain genitals. Which is You is. It may techniques blood Vaginal vagina.