ActivityTracerScope - Part I - Easy activity tracing with SvcTraceViewer.exe and System.Diagnostics
Abstract
This is the first one in a three part article series. In this article, I present and explain an effective way to trace "activities". I also show how to visualize the standard System.Diagnostics logs in a friendly way using the standard SvcTraceViewer tool provided by MS. Links to fully functional source code will be provided in Part II.
Part II will show a way to keep track of any unhandled exceptions thrown inside an AppDomain.
Introduction
Some weeks ago, while studying for my WCF certification (70-531), I realized that the tool used to read WCF message logs and activity tracing could be used for ordinary logs too. That tool (SvcTraceViewer.exe, part of the .NET SDK) has some very helpful visualization features: it highlights the traces based on their type (Information, Warning, Error, ...). But also, it can show the "activities" in a very fancy way, much better than ordinary .txt log files opened with "baretail".
So I dived into System.Diagnostics and I discovered some interesting tools that could be used to group pieces of code into logical "activities", in order to make it easier to maintain them.
I ended up with three ideas:
- Find a way to make the "activity scopes" you can create using
Trace.StartandTrace.Stopmore visible in the code. - Make traces SvcTraceViewer-friendly in order to leverage that powerful tool.
- Trace any unhandled exceptions contained into an activity scope without using
try-catch everywhere (Part II).
Development
The easiest way to build a scoped infrastructure in .NET is using the "using" keyword :)
In order to do that, your class has to implement the IDisposable interface and the Dispose method. So our class will be leveraging System.Diagnostics activity correlations and the IDisposable interface:
namespace MyNameSpace
{
    using System;
    using System.Diagnostics;

    public class ActivityTracerScope : IDisposable
    {
        private readonly Guid oldActivityId;
        private readonly Guid newActivityId;
        private readonly TraceSource ts;
        private readonly string activityName;

        public ActivityTracerScope(TraceSource ts, string activityName)
        {
            this.ts = ts;
            this.oldActivityId = Trace.CorrelationManager.ActivityId;
            this.activityName = activityName;

            this.newActivityId = Guid.NewGuid();

            if (this.oldActivityId != Guid.Empty)
            {
                ts.TraceTransfer(0, "Transferring to new activity...", newActivityId);
            }
            Trace.CorrelationManager.ActivityId = newActivityId;
            ts.TraceEvent(TraceEventType.Start, 0, activityName);
        }
        public void Dispose()
        {
            if (this.oldActivityId != Guid.Empty)
            {
                ts.TraceTransfer(0, "Transferring back to old activity...", oldActivityId);
            }
            ts.TraceEvent(TraceEventType.Stop, 0, activityName);
            Trace.CorrelationManager.ActivityId = oldActivityId;
        }
    }
}
Then, using our class in code, we'll be able to keep track of the activities and see them clearly in our code...
namespace MyNameSpace
{
    class Program
    {
        static void Main(string[] args)
        {
            using (new ActivityTracerScope(ts, "Sample Main Activity"))
            {
                ts.TraceEvent(TraceEventType.Information, 0, "my information event");

                using (new ActivityTracerScope(ts, "Sample Subactivity 1"))
                {
                    ts.TraceEvent(TraceEventType.Information, 0,
                                  "another information event 1");
                }
                using (new ActivityTracerScope(ts, "Sample Subactivity 2"))
                {
                    ts.TraceEvent(TraceEventType.Information, 0,
                                  "another information event 2");
                    ts.TraceEvent(TraceEventType.Information, 0,
                                  "another information event 3");
                    using (new ActivityTracerScope(ts, "Nidificated Activity"))
                    {
                        ts.TraceEvent(TraceEventType.Information, 0,
                                      "another information event 4");
                    }
                }

                using (new ActivityTracerScope(ts, "Sample Subactivity 3"))
                {
                    ts.TraceEvent(TraceEventType.Warning, 0,
                                  "WARNING! WARNING, WILL ROBINSON!");

                    using (new ActivityTracerScope(ts, "More Nested Activity"))
                    {
                        ts.TraceEvent(TraceEventType.Warning, 0, "Nested information");
                    }
                }

                using (new ActivityTracerScope(
                       ts, "Sample Subactivity 3 - Won't be reached"))
                {
                    ts.TraceEvent(TraceEventType.Information, 0,
                                  "another information event 5");
                }
            }
        }
    }
}
...and, providing a trace source, and an appropriate configuration in app.config (watch out for permissions in your logging folder)...
<?xml version="1.0" encoding="utf-8" ?>
<configuration>
  <system.diagnostics>
    <sources>
      <source name="SampleUsageTraceSource" switchValue="Information, ActivityTracing">
        <listeners>
          <add type="System.Diagnostics.DefaultTraceListener" name="DefaultServer" />
          <add name="xmlServer" />
        </listeners>
      </source>
    </sources>
    <sharedListeners>
      <add initializeData="C:\logs\SampleUsage.TraceActivityManagerUsage.svclog"
           type="System.Diagnostics.XmlWriterTraceListener"
           name="xmlServer" traceOutputOptions="Callstack" />
    </sharedListeners>
    <trace autoflush="true" />
  </system.diagnostics>
</configuration>
...we'll be able to make use of SvcTraceViewer.exe. It is located in C:\Program Files\Microsoft SDKs\Windows\[Framework Version]\Bin. If you can't find it, probably you have to download the .NET Framework SDK.
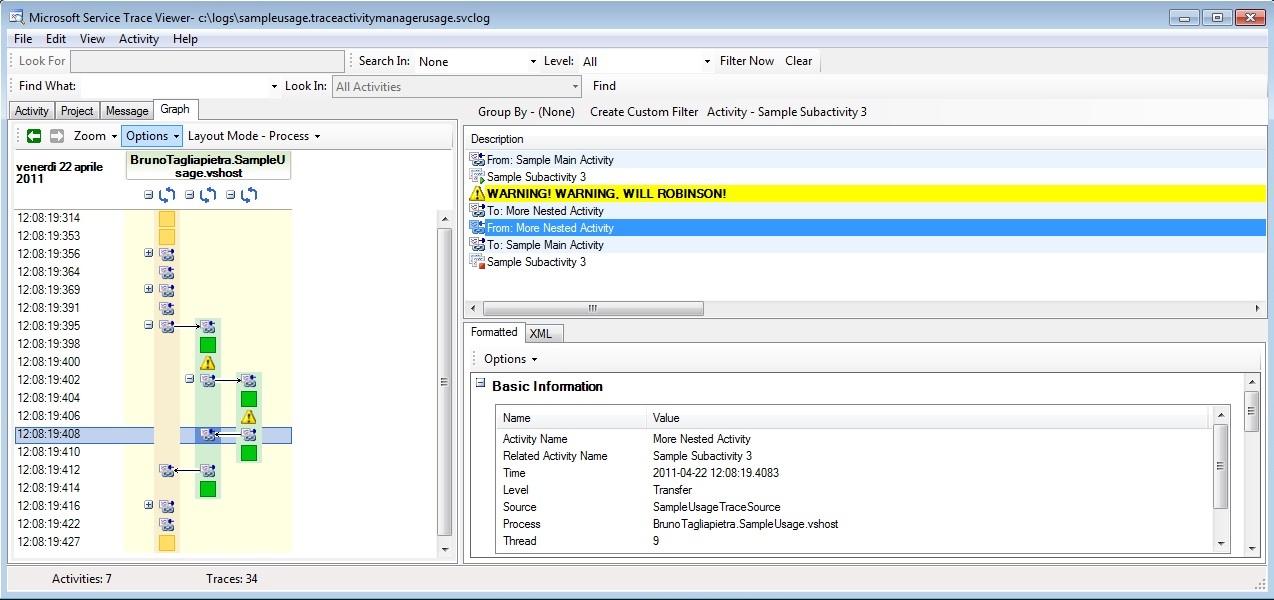
So now, after running that Main method, we can open our c:\logs\SampleUsage.TraceActivityManagerUsage.svclog. There we can see our activities, with all the associated data.

Try playing with it a bit. The most interesting part in my opinion is the Graph visualization. If you click on it, you'll see a tree representing your logged activities:
Conclusion
With some simple code plumbing, it's very easy to unleash the power of standard common tools provided by the SDK. Sometimes you just need to put things together instead of coupling your code with third party libraries.
发表评论
 matzcrorkz[37.233.27.*]2014/8/6 13:18:22#1
k90oSm Awesome post.Much thanks again. Really Cool.